Ripple Price Analysis: These Are XRP’s Next Defense Lines After a Breakdown Below $3
Main Idea
The article discusses the bearish trends in XRP/USDT and XRP/BTC pairs, highlighting key support and resistance levels and potential price movements.
Key Points
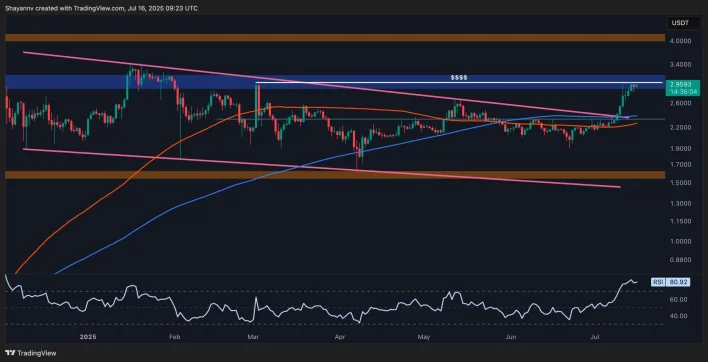
1. The XRP/USDT pair has been rising since early July but is now pulling back toward the 100-day and 200-day moving averages near the $2.50 mark.
2. The $3.00 level is lost for XRP/USDT, and a quick recovery above $1.60 is possible if support holds.
3. The XRP/BTC pair is testing the 200-day moving average and the higher boundary of a broken descending channel around the 2,500 SAT mark.
4. The RSI for XRP/BTC has dropped from overbought levels to below 50, indicating a shift in momentum.
5. If the 2,500 SAT support zone is broken, the price could pull toward the 2,000 SAT area.
Description
Ripple’s price is experiencing a pullback after an impulsive rally that began in June. As both the USDT and BTC pairs are now showing signs of bearish momentum, investors are cautiously looking to see if the available support levels can hold and prevent a full-on reversal. Technical Analysis By ShayanMarkets The USDT Pair On the XRP/USDT pair, Ripple’s token has been rising since early July, before sweeping the liquidity above the $3.40 high and reversing to the downside. The market is currently...

Latest News
- BTC Hits New ATH, ETH Pushes Higher as Trump-Putin Meeting Grabs Spotlight: Your Weekly Crypto Recap2025-08-15 13:29:41
- Will Bitcoin’s Next Move Be Explosive? Here’s What the Data Says2025-08-15 12:43:57
- Arthur Hayes on the Move Again: Here’s What He Bought Today2025-08-15 12:26:26
- Has XRP’s Bull Run Just Begun or Is the Top Already In? AI Models Predict 2025 Peak Price2025-08-15 11:31:55
- Ethereum Exit Queue Heating up Again: 808,880 ETH Worth $3.7B Held Up2025-08-15 10:43:15