Bitcoin Price Analysis: BTC Troubles Just Getting Started After 3% Daily Decline?
Main Idea
Bitcoin has broken below its previous trading range and is testing a key support level at $114K, with potential for further decline or a short-term rebound depending on market demand and liquidity.
Key Points
1. Bitcoin dropped below its previous range of $116K to $123K, testing a major support level near $114K.
2. The price was rejected from the upper boundary of a rising flag near $118K, indicating strong selling pressure.
3. A break below the $114K support level could lead to further declines, while a rebound could push the price back toward $118K.
4. Liquidity pockets above $120K and below $114K are influencing price movements, with potential for sharp downside momentum if $114K is breached.
5. The 0.5 Fibonacci retracement level at $114K creates a strong support area, making it a pivotal level for Bitcoin's mid-term trend.
Description
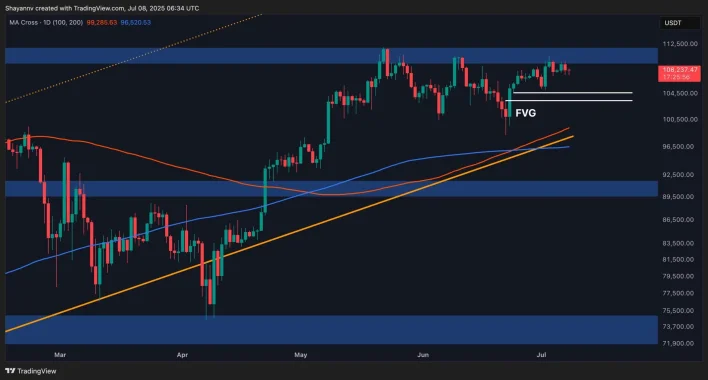
Bitcoin is showing clear signs of weakness, with increasing selling pressure driving the price lower. The asset has now approached a decisive multi-month support zone, with a confirmed breakdown triggering a sharp decline toward the $111K threshold. Technical Analysis By ShayanMarkets The Daily Chart After an extended period of sideways movement within the $116K to $123K range, Bitcoin has now turned downward, breaching the lower threshold. This drop signals a rise in distribution and selling in...

Latest News
- BTC Hits New ATH, ETH Pushes Higher as Trump-Putin Meeting Grabs Spotlight: Your Weekly Crypto Recap2025-08-15 13:29:41
- Will Bitcoin’s Next Move Be Explosive? Here’s What the Data Says2025-08-15 12:43:57
- Arthur Hayes on the Move Again: Here’s What He Bought Today2025-08-15 12:26:26
- Has XRP’s Bull Run Just Begun or Is the Top Already In? AI Models Predict 2025 Peak Price2025-08-15 11:31:55
- Ethereum Exit Queue Heating up Again: 808,880 ETH Worth $3.7B Held Up2025-08-15 10:43:15